Independent, source-linked public records
Compare private schools using the public facts that are actually comparable.
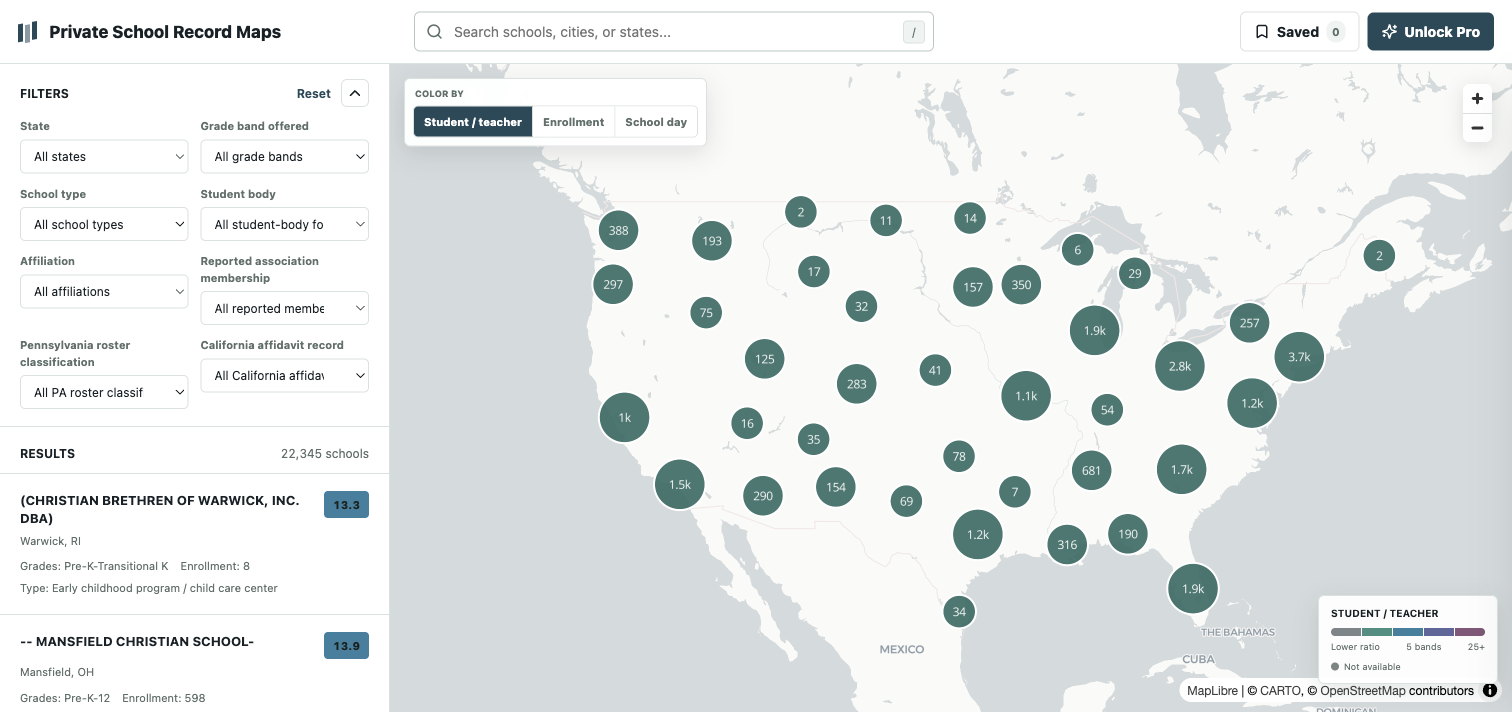
Filter NCES records by grades, program type, student body, enrollment, staffing ratio, affiliation, library, homeschooling support, and reported associations. Matched Pennsylvania and California schools also show separate state-source facts.
What the data adds
Research the record before the sales conversation.
Find the complete field
Search the public roster instead of a paid subset, then filter on facts that affect fit.
Keep dimensions separate
Licensing, activity, inspections, services, and outcomes stay distinct rather than becoming an opaque score.
Verify at the source
Each record retains provenance so time-sensitive claims can be checked before a decision.
Current release
Built from named public sources
This release transforms the NCES 2021-22 Private School Survey public-use file using permanent school IDs and the official codebook. It adds exact, one-to-one matched Pennsylvania SY2526 roster classifications and California 2025-26 affidavit records while excluding ambiguous matches. It preserves each source's vintage and legal meaning, treats association answers and state records as distinct facts rather than accreditation, and does not turn filing, classification, size, staffing, calendar, affiliation, or program type into a school-quality score.
- NCES Private School Survey 2021-22Source records preserved with observation dates and links.
- Pennsylvania Department of Education private-school roster SY2526Source records preserved with observation dates and links.
- California Private School Affidavit data 2025-26Source records preserved with observation dates and links.
- Lower ratio 8,90239.8%
- 8 to under 12 6,68129.9%
- 12 to under 18 5,29423.7%
- 18 to under 25 1,0284.6%
- 25+ 4402.0%
- Missing / not reported 00.0%
- Records
- 22,345
- Sources
- 3
- Source-linked pages
- 22,345
Research library
Use the data, then use the guide.
Common questions
What this record can and cannot tell you
Are the records current admissions data?
No. They reflect the NCES 2021–22 survey.
Is association membership accreditation?
No. Verify accreditation separately.
Does a lower student-teacher ratio mean smaller classes?
Not necessarily; ratio and class size measure different things.